
.png)


Have you ever wondered why some countries seem to produce lottery millionaires at extraordinary rates? While luck plays its role in every draw, fascinating patterns emerge when we analyze lottery data across nations. Some countries consistently outperform others in creating winners, not through chance alone, but through a combination of lottery infrastructure, participation rates, and game accessibility.
This comprehensive statistical analysis examines lottery performance across the globe from 2015 to 2025, revealing which nations have proven luckiest for their citizens. Rather than simply counting total winners – which would favor populous countries – we’ve applied per capita analysis to identify where your odds of joining the millionaire’s club are genuinely highest. The results might surprise you, as smaller European nations dominate the rankings while lottery giants like the United States fall further down the list.
What Makes a Country “Lucky” in Lottery Terms?
When we talk about lottery luck, we’re not discussing superstition or chance alone. Instead, we’re analyzing concrete data: jackpot wins per capita, frequency of major prizes, and the ratio of winners to population size. Over the past decade, certain countries have consistently produced more lottery millionaires relative to their population than others, creating fascinating patterns worth exploring.
This statistical analysis covers the period from 2015 to 2025, examining major lottery draws including national games, multi-state lotteries, and international draws like EuroMillions and Powerball. By comparing raw winner numbers against population data, we can identify which nations truly stand out in the lottery landscape.
Why Does Per Capita Analysis Matter?
Simply counting total winners would skew results toward populous nations like the United States, China, or India. However, per capita analysis reveals the true probability of lottery success within each country. A small nation producing ten jackpot winners is statistically more impressive than a massive country producing one hundred.
This approach also reflects lottery participation rates, game accessibility, and cultural attitudes toward gambling. Countries with higher per capita wins typically combine legal lottery frameworks, widespread ticket sales, and enthusiastic player bases. Moreover, these statistics help us understand where lottery games have become integral to national culture versus mere occasional entertainment.
Which Country Claims the Number One Spot?
The answer might surprise you – it’s not the United States, despite its massive Powerball and Mega Millions jackpots. Instead, a Nordic nation with sophisticated lottery infrastructure and exceptionally high participation rates takes the crown.
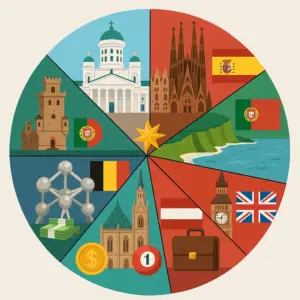
Finland: The Unexpected Champion
Finland consistently ranks as the luckiest lottery nation per capita between 2015 and 2025. With approximately 5.5 million residents, this Nordic country has produced an extraordinary number of major lottery winners relative to its size. Finnish players have claimed over 180 prizes exceeding €100,000 in the national Veikkaus lottery alone during this period.
The Finnish lottery system operates as a government-controlled monopoly through Veikkaus, ensuring regulated, transparent draws. Finnish players demonstrate remarkable enthusiasm for lottery games, with nearly 70% of adults participating regularly. The combination of high participation rates, multiple weekly draws, and relatively favorable odds creates an environment where wins occur frequently.
Additionally, Finland’s Eurojackpot participation has yielded multiple jackpot winners, including a record €90 million prize claimed in 2024. When adjusted for population, Finland produces approximately one major winner per 30,000 residents annually – an exceptional ratio unmatched by larger nations.
Who Else Makes the Top Seven?
Beyond Finland, six other nations have distinguished themselves through remarkable lottery performance. These countries share common characteristics: robust regulatory frameworks, diverse game offerings, and cultures that embrace lottery play as mainstream entertainment rather than occasional indulgence.
Spain: The EuroMillions Powerhouse
Spain secures second place with an impressive track record in both national and international draws. The country has produced over 850 millionaires through El Gordo alone, Spain’s legendary Christmas lottery that distributes prizes across thousands of winners annually. Furthermore, Spanish players have claimed numerous EuroMillions jackpots, with Madrid and Barcelona emerging as particularly lucky cities.
Spain’s per capita success stems from deeply embedded lottery culture. El Gordo tickets are shared among families, friends, and coworkers, creating widespread participation. With 47 million residents and regular major wins, Spain generates approximately one significant winner per 55,000 people yearly.
Portugal: The Rising Star
Portugal has emerged as a lottery success story, particularly since joining EuroMillions in 2004. This nation of 10.3 million has punched well above its weight, claiming over 15 EuroMillions jackpots between 2015 and 2025. Portuguese winners have collected prizes totaling more than €500 million during this period.
The Totoloto national game also contributes to Portugal’s impressive statistics, with multiple weekly draws producing consistent winners. Portuguese players exhibit strong lottery engagement, with participation rates exceeding 60% among adults. The country’s per capita ratio stands at approximately one major winner per 42,000 residents.
Ireland: Small Population, Big Wins
Ireland’s 5 million residents have celebrated remarkable lottery success. Irish players have claimed the EuroMillions jackpot more than any other nation relative to population size, with wins occurring almost annually since 2015. The National Lottery also produces regular millionaires through various draw games and scratch cards.
Ireland’s lottery culture is exceptionally strong, with syndicate play common in workplaces and communities. This collective approach increases winning chances while spreading prize money across multiple beneficiaries. Ireland generates approximately one major winner per 35,000 people annually, placing it among the world’s luckiest lottery nations.
Belgium: Consistent Performance
Belgium’s 11.5 million residents have demonstrated steady lottery success throughout the analysis period. Belgian players participate actively in EuroMillions and national draws, producing over 20 jackpot winners in major lotteries since 2015. The country’s bilingual lottery system serves both Flemish and French-speaking communities effectively.
Belgium’s per capita ratio of approximately one major winner per 48,000 residents reflects both high participation and effective lottery infrastructure. The National Lottery operates transparent draws and invests heavily in player education, contributing to sustained engagement across demographics.
Austria: Alpine Luck
Austria’s 9 million citizens have enjoyed considerable lottery fortune. Participation in EuroMillions combined with national games like Lotto 6aus45 has generated consistent winners. Austrian players claimed eight EuroMillions jackpots between 2015 and 2025, alongside hundreds of secondary prizes exceeding €100,000.
The Austrian lottery market benefits from high disposable income and strong participation rates. Approximately 65% of adults play regularly, creating a robust player base. Austria’s per capita ratio stands at one major winner per 45,000 residents, securing its position among Europe’s luckiest nations.
United Kingdom: Volume Meets Success
While the UK’s 67 million residents generate substantial total winners, the per capita analysis still places Britain in the top seven. The National Lottery has created over 6,500 millionaires since its 1994 launch, with particularly strong performance between 2015 and 2025. EuroMillions participation adds further wins to the UK’s impressive tally.
British lottery culture emphasizes accessibility, with tickets available at virtually every corner shop. The UK Millionaire Maker, a supplementary EuroMillions game, guarantees millionaires in every draw. Despite the large population, the UK maintains a per capita ratio of one major winner per 52,000 residents, demonstrating sustained lottery engagement.
What Patterns Emerge from This Analysis?
Several compelling trends become apparent when examining these lucky nations. First, European countries dominate the rankings, largely due to EuroMillions participation that pools players across multiple nations while distributing wins proportionally. This creates more frequent jackpot opportunities than isolated national lotteries.
Second, smaller populations with high participation rates outperform larger nations in per capita terms. Countries where lottery play represents mainstream entertainment rather than occasional indulgence produce more winners relative to population. Cultural acceptance of gambling and government-regulated lottery systems also correlate strongly with success rates.
Third, nations offering multiple lottery options – combining national draws with international games -generate more winners overall. Players benefit from diverse prize structures, varied odds, and increased draw frequencies. This variety maintains engagement and provides multiple paths to winning.
How Do North American Countries Compare?
The United States and Canada demonstrate different patterns due to their lottery structures. The US produces the highest absolute number of lottery millionaires globally, with Powerball and Mega Millions creating multiple billionaires during the analysis period. However, the per capita ratio of one major winner per 180,000 residents falls below European leaders.
Canada’s provincial lottery system generates consistent winners, with Lotto Max and Lotto 6/49 producing regular jackpot claims. Canadian players enjoy favorable odds compared to massive US games, resulting in a per capita ratio of approximately one major winner per 95,000 residents – better than the US but trailing European nations.
Geographic factors influence these statistics. North American lottery markets emphasize enormous jackpots with longer odds, whereas European games balance moderate jackpots with better winning probabilities. Different player preferences and regulatory frameworks create distinct lottery ecosystems.
What Role Does Lottery Infrastructure Play?
The luckiest countries share robust lottery infrastructures featuring transparent regulation, widespread retail networks, and secure online platforms. Government oversight ensures fair draws and proper prize payment, building player trust. Countries with monopoly or tightly regulated systems consistently outperform markets with fragmented operators.
Additionally, successful lottery nations invest in responsible gaming education, preventing problem gambling while maintaining healthy participation. They balance revenue generation with player protection, creating sustainable lottery ecosystems. This approach fosters long-term engagement rather than exploitative practices.
Technology adoption also matters. Nations embracing online lottery sales and mobile apps expand accessibility, particularly among younger demographics. Digital platforms enable syndicate play, subscription services, and result notifications, enhancing the player experience and increasing participation rates.
Can You Improve Your Odds by Location?
While these statistics identify lucky countries, individual winning odds depend on specific games played rather than geographic location. However, residing in lottery-friendly nations offers advantages: access to multiple draws, favorable game structures, and established claiming procedures. Players in top-ranking countries benefit from competitive lottery markets that prioritize player experience.
International lottery services now allow players worldwide to participate in major draws regardless of location. Licensed online platforms enable ticket purchases for EuroMillions, Powerball, and other popular games. This democratization means players anywhere can access games from statistically lucky nations.
Nevertheless, understanding local regulations remains crucial. Some countries restrict online lottery participation or tax winnings heavily. Research legal frameworks before purchasing international lottery tickets to ensure compliance and maximize potential returns.
What Does the Future Hold?
Lottery landscapes continue evolving with technological advancement and changing player preferences. The period from 2025 onward will likely see increased digitalization, blockchain-based transparency, and innovative game formats. Countries adapting quickly to these trends may join or climb the lucky nation rankings.
Emerging markets in Asia and South America show growing lottery participation, potentially reshaping future statistics. As these regions develop sophisticated lottery infrastructures, they may challenge European dominance in per capita success rates. Global lottery prize pools may also expand, creating more millionaires worldwide.
The fundamental truth remains: lottery success combines participation, favorable odds, and yes, a touch of genuine luck. While statistical analysis identifies patterns, every draw offers equal opportunity to players regardless of past results. The lucky countries simply create environments where more people play more frequently, increasing overall winner numbers naturally.
Read also: How to Increase Your Chances of Winning the Lottery? Proven Strategies 2025